Fichier:Sunspot Numbers German.png
Translation
This is the German translation of the original English image, created by Xavax.
Resümmee

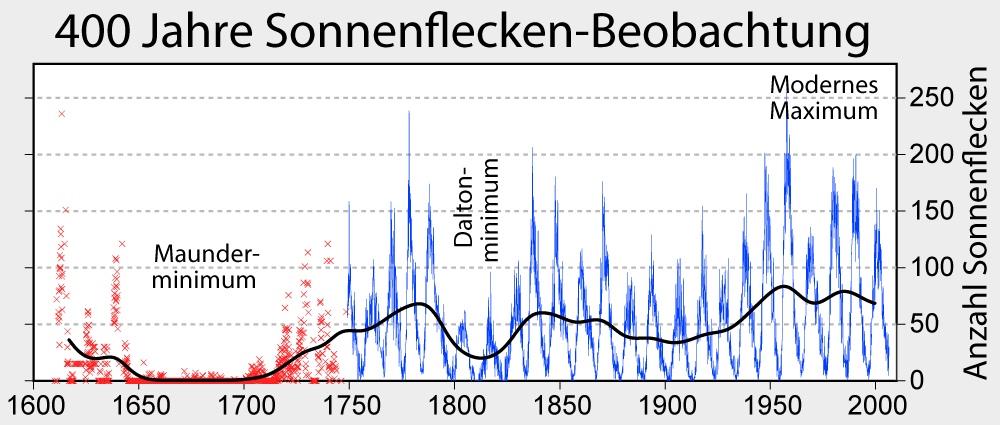
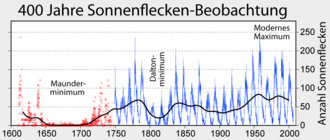
This figure summarizes the 400 years of regular sunspot number observations. Since ~1749, continuous monthly averages[toter Link] of sunspot activity have been available and are shown here as reported by the Solar Influences Data Analysis Center, World Data Center for the Sunspot Index, at the Royal Observatory of Belgium. These figure are based on an average of measurements from many different observatories around the world. Prior to 1749, sporadic observations of sunspots are available. These were compiled and placed on consistent monthly framework[toter Link] by Hoyt & Schatten (1998a, 1998b).
The most prominent feature of this graph is the ~11 year solar magnetic cycle which is associated with the natural waxing and waning of solar activity.
On longer time scales, the sun has shown considerable variability, including the long Maunder Minimum when almost no sunspots were observed, the less severe Dalton Minimum, and increased sunspot activity during the last fifty years, known as the Modern Maximum. The causes for these variations are not well understood, but because sunspots and associated faculae affect the brightness of the sun, solar luminosity is lower during periods of low sunspot activity. It is widely believed that the low solar activity during the Maunder Minimum and earlier periods may be among the principle causes of the Little Ice Age. Similarly, the Modern Maximum is partly responsible for global warming, especially the temperature increases between 1900 and 1950. Residual warming due to the sustained high level of activity since 1950 is believed responsible for 16 to 36% of recent warming (Stott et al. 2003).
Copyright
This figure was prepared by Robert A. Rohde and is part of the Global Warming Art project.

|
Et ass erlaabt, dëse Fichier ënner de Bedingunge vun der GNU-Lizenz fir fräi Dokumentatioun, an der Versioun 1.2 oder enger spéiderer Versioun, verëffentlecht vun der Free Software Foundation, ze kopéieren, ze verbreeden an/oder zu modifizéieren, ouni onverännerlech Abschnitter, Ëmschlagtext virdrun, Ëmschlagtext hannendrun. De kompletten Text vun der Lizenz ass am Kapitel GNU-Lizenz fir fräi Dokumentatioun ze gesinn. |
| Dëse Fichier ass ënner der Creative Commons Attribution-Share Alike 3.0 Unported Lizenz disponibel. | ||
| ||
| Dës Lizenz-Markéierung gouf bei dëse Fichier dobäigesat als Deel vun der GFDL Lizenz-Aktualisatioun. |
References
- Hoyt, D. V., and K. H. Schatten (1998a). "Group sunspot numbers: A new solar activity reconstruction. Part 1.". Solar Physics 179: 189-219.
- Hoyt, D. V., and K. H. Schatten (1998b). "Group sunspot numbers: A new solar activity reconstruction. Part 2.". Solar Physics 181: 491-512.
- Stott, Peter A.; Gareth S. Jones and John F. B. Mitchell (15 December 2003). "Do Models Underestimate the Solar Contribution to Recent Climate Change". Journal of Climate 16: 4079-4093. Archived from the original on 2005-05-15. Retrieved on 2006-10-08.
Versiounen
Klickt op e bestëmmten Zäitpunkt fir déi respektiv Versioun vum Fichier ze kucken.
| Versioun vum | Miniaturbild | Dimensiounen | Benotzer | Bemierkung | |
|---|---|---|---|---|---|
| aktuell | 11:59, 25. Okt. 2012 | | 1.000 × 425 (36 KB) | wikimediacommons>Denniss | Reverted to version as of 23:53, 8 October 2006 |
Benotze vu Fichieren
Dës Säite benotzen dëse Fichier: